Chart styles
Charts can be drawn in seven styles. Choose one for the screen in , and separately for the chart you publish.
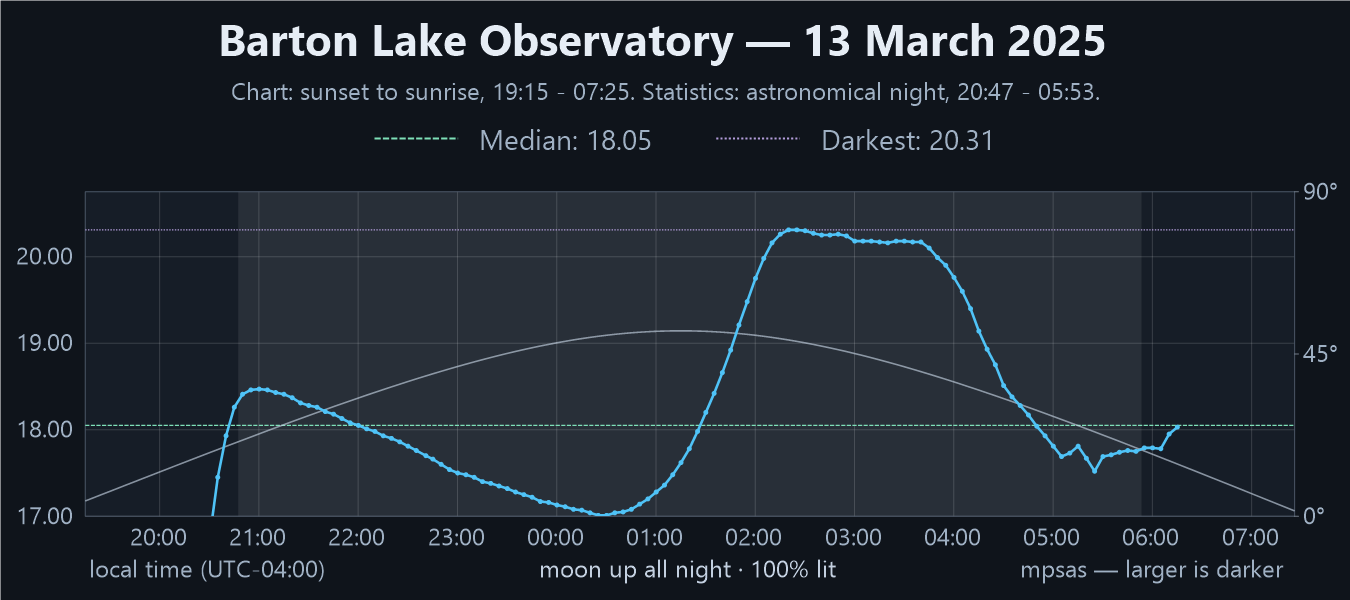
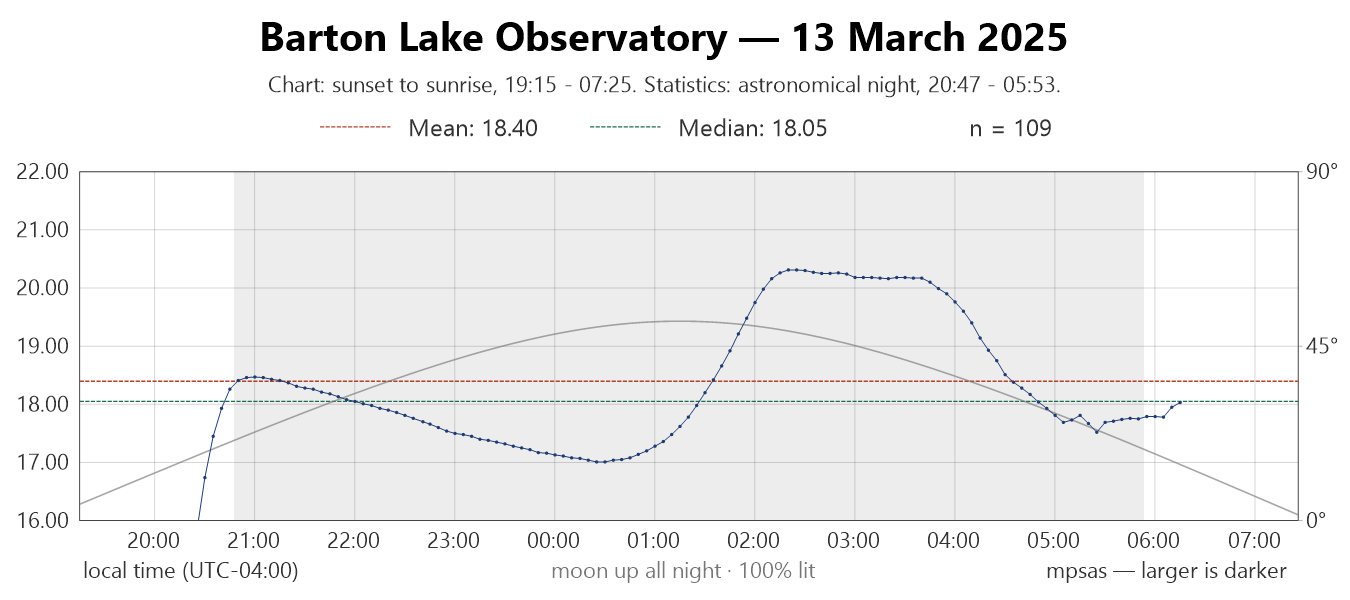
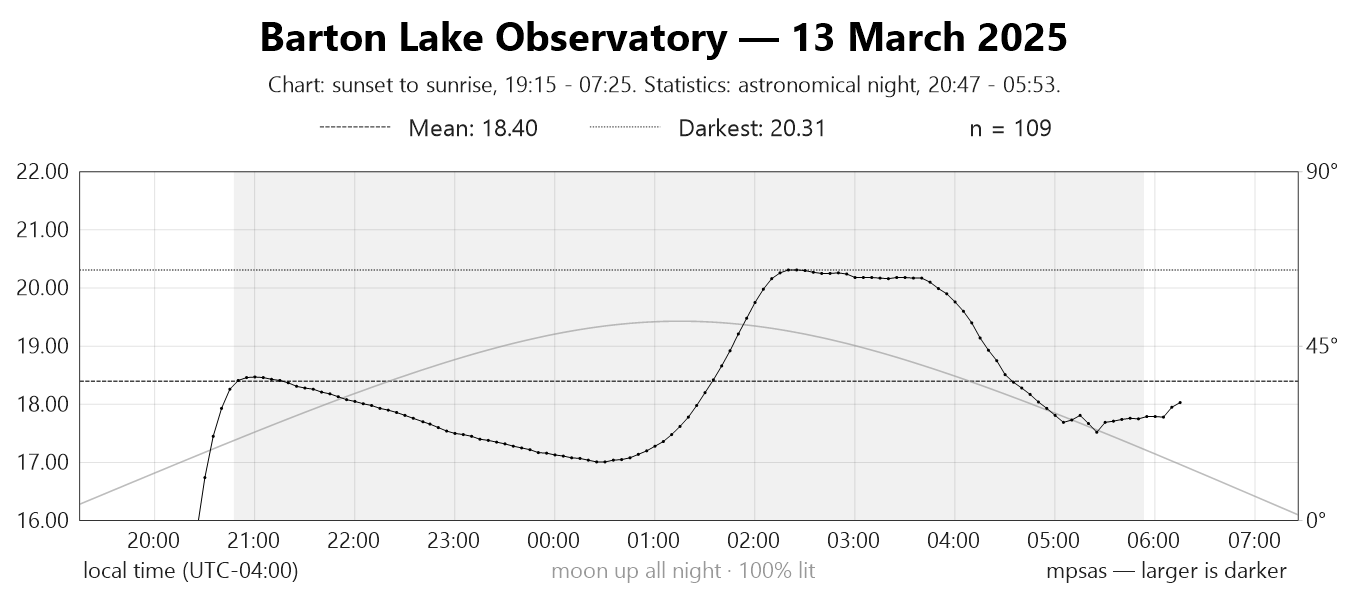
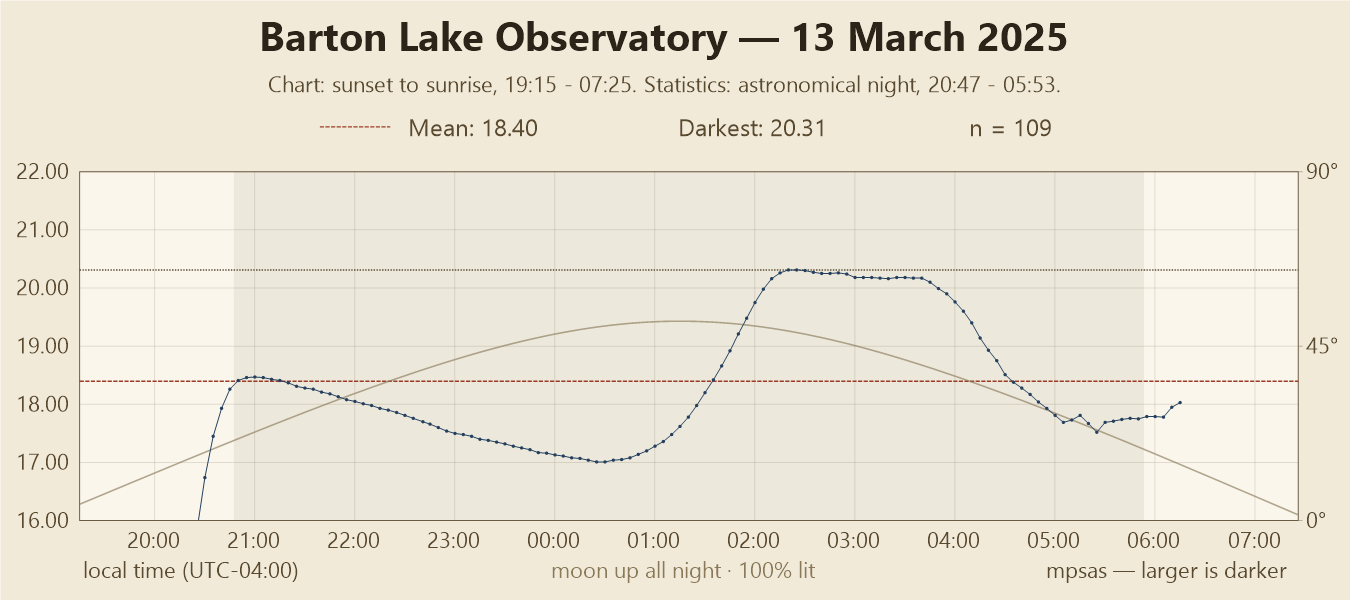
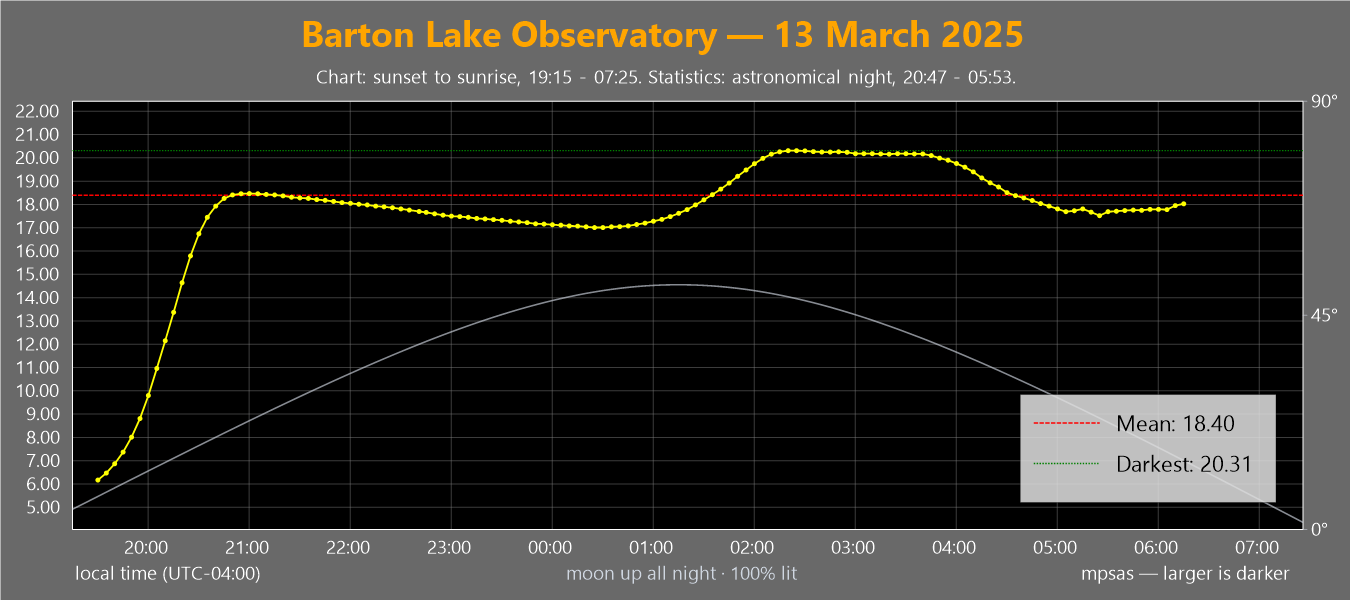
Every example below is the same night, 13 March 2025, drawn with the moon's altitude turned on (see the moon; it is off until you turn it on). A full moon was up all night, so the sky read bright, around 17 to 18.5. Then, from about 02:00 to 04:00, it darkened by two magnitudes: that was the total eclipse of the moon, while it passed through Earth's shadow.
| Style | Best for | Scale |
|---|---|---|
| Workbench | The screen; follows light and dark mode | Fixed, 16–22 |
| Midnight | A website | Follows the night |
| Slate | A dark web page or dashboard | Follows the night |
| Publication | A report or poster | Fixed, 16–22 |
| Monochrome | Printing and photocopying | Fixed, 16–22 |
| Parchment | A newsletter or printed log | Fixed, 16–22 |
| Legacy (matplotlib) | Keeping an existing web image unchanged | Fits all the data |
The scale. A fixed scale always runs from 16 to 22, so any two nights can be compared at a glance, and the space above the line shows how far the sky was from truly dark. A scale that follows the night puts its top just above the night's darkest reading, so the dark hours get more height; a bright night, such as under a full moon, drops the bottom to keep the whole night on the chart.
Workbench
The application's own look, and the only style that follows dark mode: shown here in your current mode. The shaded part is astronomical night, the part the statistics count.

Midnight
High-contrast black and amber. The best all-round choice for a published image, and the default for Chart Snapshot & Upload.
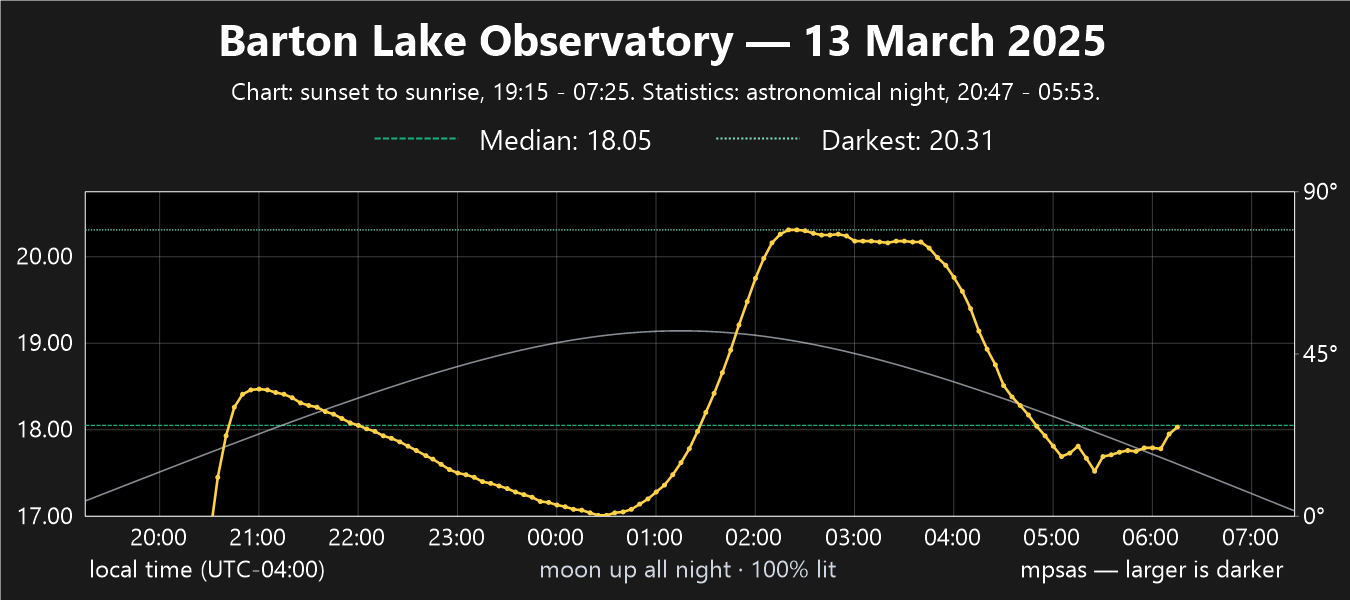
Slate
Blue-grey and cyan, for a dark web page or a dashboard.
Publication
White background, restrained colours and larger type, for a figure in a report or on a poster.
Monochrome
No colour at all: the reference lines are told apart by their dash patterns, so it survives printing in black and white and photocopying.
Parchment
Warm paper and ink, for a newsletter or a printed observing log.
Legacy (matplotlib)
The classic matplotlib chart, reproduced exactly, with a scale that fits all the data, twilight included. For keeping an existing website's image looking the same when you switch to this application. Sky bands are not drawn in this style, because its scale changes from night to night.
Every style except Workbench keeps its own colours whatever theme you use, so an exported or published image always looks the same. Saved images use the style's own size, not the size of your window.